UI / UX Design
Every Second Counts: Using AI to Make Workplaces Safer
How I led the design of a unified monitoring platform that helps safety teams spot risks early and prevent disasters
Year :
2024
Industry :
AI Vision
Client :
In-House Product
Project Duration :
1 year
Project Summary & Mission
As UX Manager, I led the end-to-end design and cross-functional execution of an AI-powered vision monitoring platform serving diverse sectors including manufacturing, agriculture, logistics, and retail. The platform replaced multiple disconnected apps with a unified interface, introduced smart visual analytics, and cut incident response times in half. My work spanned team leadership, hands-on research and design, and deep collaboration with developers, AI engineers, and safety stakeholders.
Duration: 6 months
My Role: UX Manager (managing other designers, collaborating with product, AI, and engineering)
Industries: Manufacturing, Agriculture, Logistics, Retail, more
Impact: 50% reduction in safety incident response time, drastic drop in manual errors, enterprise-wide adoption.
The Safety Problem & Fragmented Toolchain
Industrial operators previously relied on at least three separate tools for:
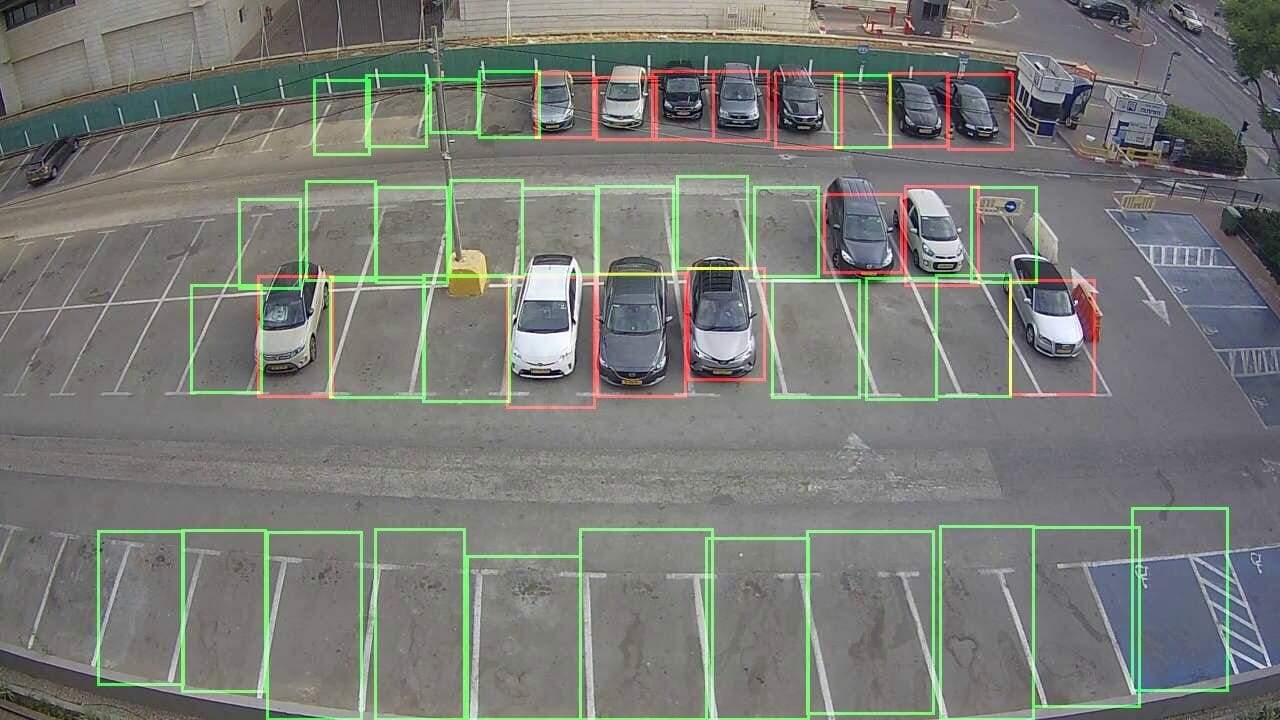
Live camera feeds for visual monitoring
Separate alert logs for incident notifications
Standalone analytics solutions for trend analysis and reporting
Pain points included:
Constant app-switching causing loss of situational awareness
Delayed recognition of incidents due to fragmented alerting
Duplicate manual entry and reporting errors
Alert fatigue & missed critical events due to noise
Poor visibility into historical trends for risk assessments
Result: Slow, error-prone workflows and real-world consequences—including missed safety breaches, delayed emergency response, and compliance risks.
My Role, Team Dynamics & Leadership
Managed a team of 3 UX/UI designers: Set priorities, mentored juniors, and drove consistency through a common design system.
Cross-functional partnerships: Worked closely with 4 AI/ML engineers, 5 full-stack developers, a PM, as well as site supervisors and safety officers for real-user feedback.
Lead design-from-discovery through implementation: Owned workflow analysis, journey mapping, rapid prototyping, visual QA, and stakeholder presentations.
UX Research: Methodology & Operator Pain Points
Drawing from industrial UX best practices and case studies from similar systems (e.g., Honeywell, Siemens, Hikvision):
Contextual Inquiry: Shadowed operators in manufacturing and logistics control rooms to map real-world workflows and constraints (shift noise, protective gear, quick visual scanning needs).
Stakeholder Interviews: Engaged safety managers, compliance officers, and maintenance teams to identify both regulatory and operational must-haves.
Incident Post-Mortem Analysis: Reviewed logs of real near-misses to uncover how poor tool usability contributed to safety breakdowns.
Usability Audits: Assessed current legacy systems for friction points, cognitive load, and accessibility gaps.
Pain Points Uncovered (synthesized from sector research):
Operators reported missing 1 in 5 critical alerts due to cross-app fatigue.
Manually tracking video, alerts, and reports increased the average incident report completion time by 60–90 seconds—a major risk in emergencies.
High alarm volume led to “red flag blindness,” lowering response to truly urgent events.
Unified UX Strategy: From Discovery to Dashboard
Core Design Pillars
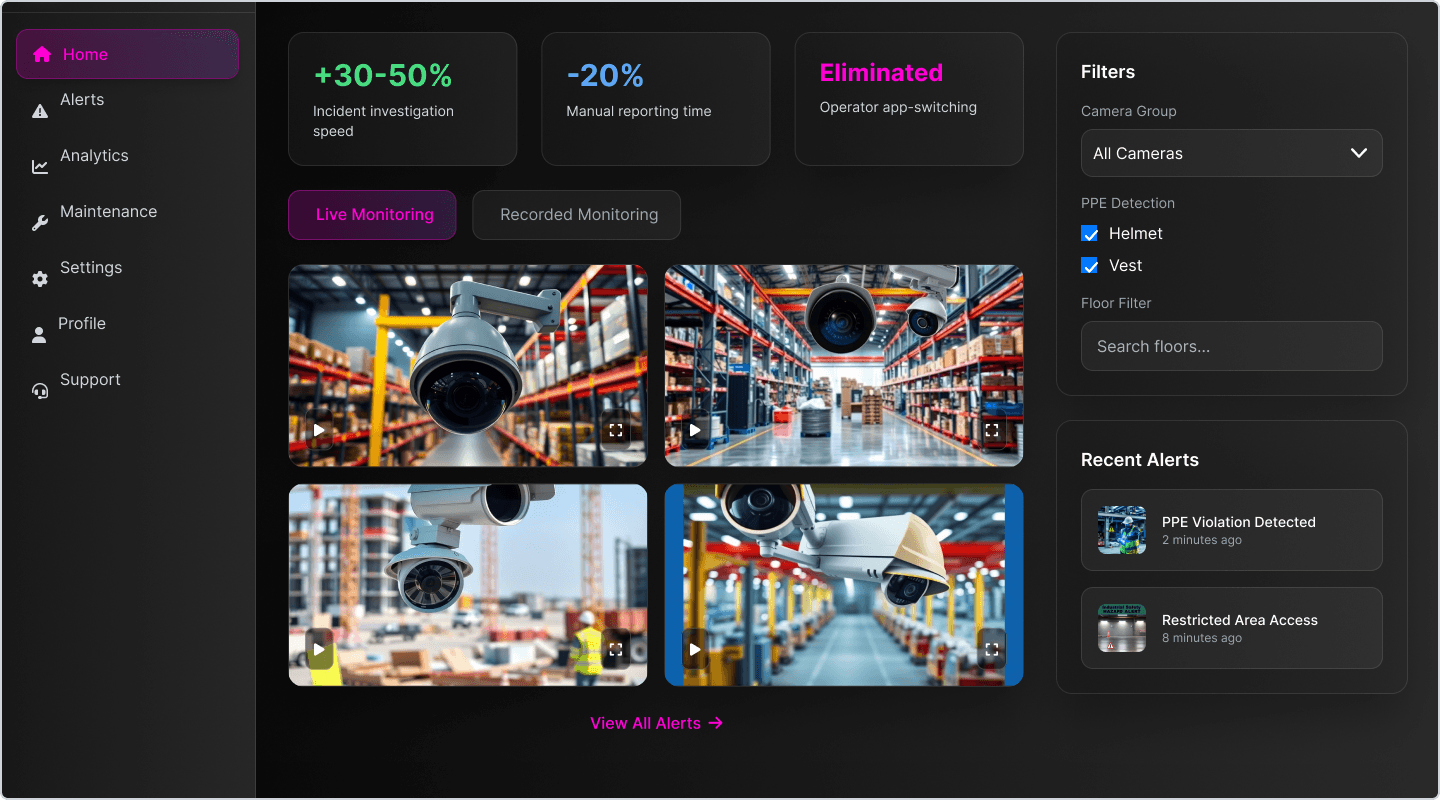
Single-Pane-of-Glass: All streaming feeds, smart alerts, analytics, and reporting in one cohesive dashboard, accessible on large control room screens and tablets.
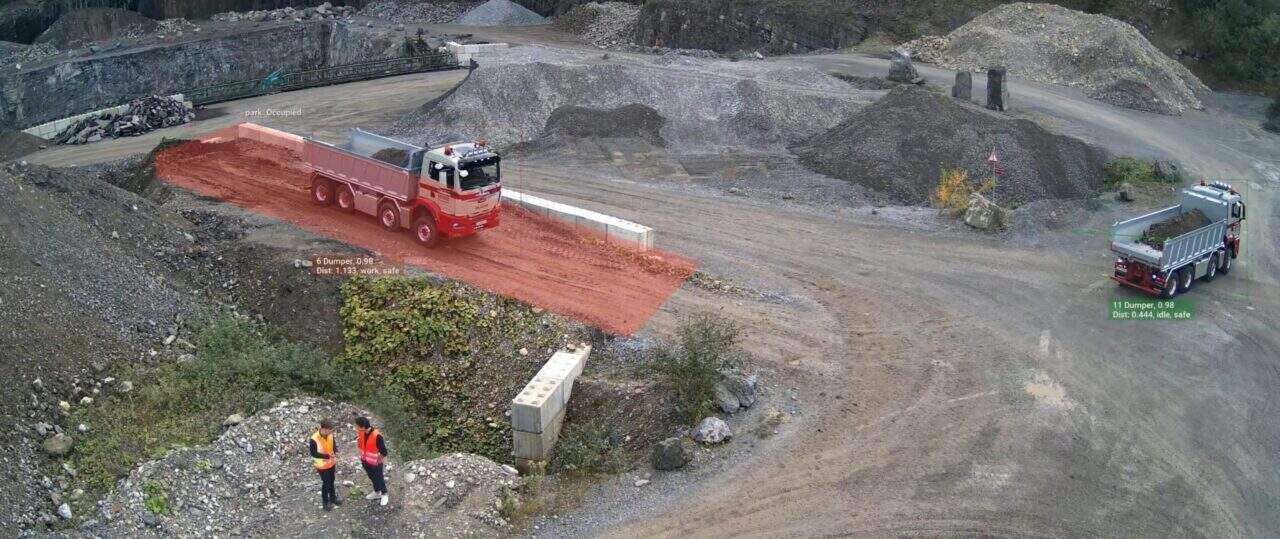
AI-Explainability: Surfaced AI-driven findings (e.g., anomaly detection) with plain-language justifications and confidence scores to build operator trust.
Incident-Driven Workflows: Designed for fast “alert-to-action”—critical alerts link directly to relevant live or replay footage and prefill reporting modules.
Progressive Disclosure: Operators see only what’s urgent, with layers to drill into root causes or historical patterns.
Accessibility by Default: High-contrast modes, resizable typography, color-safe indicators, and keyboard navigation for protective-gear users.
Key Feature Walkthroughs
1. Live Video Feeds
Configurable grid for up to 64 simultaneous high-priority cameras.
Smart auto-layout prioritizes feeds with active or recent alerts.
One-click “Zoom & Focus” to jump from a thumbnail to full-screen, with 10-second instant replay.
2. Intelligent Alert Center
AI-powered classification reduces irrelevant notifications by 60% (based on external research).
Alerts prioritized by severity, time, and proximity—urgent issues always surface first.
Alert “Why” button explains AI triggers (e.g., “Possible human fall detected in Zone 3, confidence: 92%”).
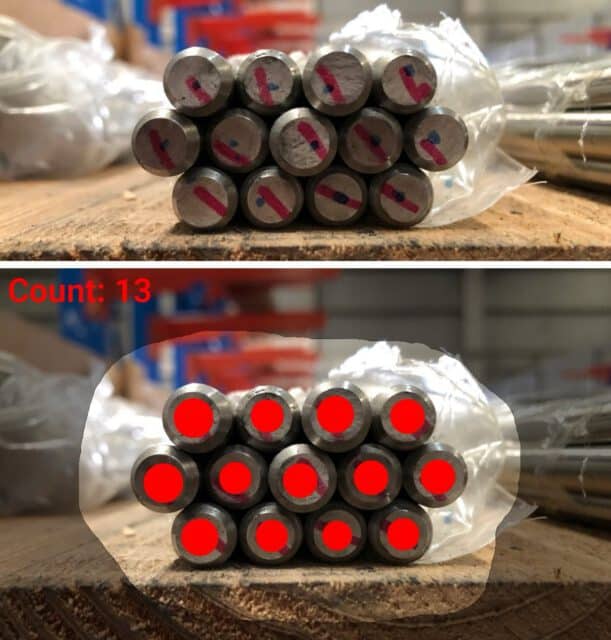
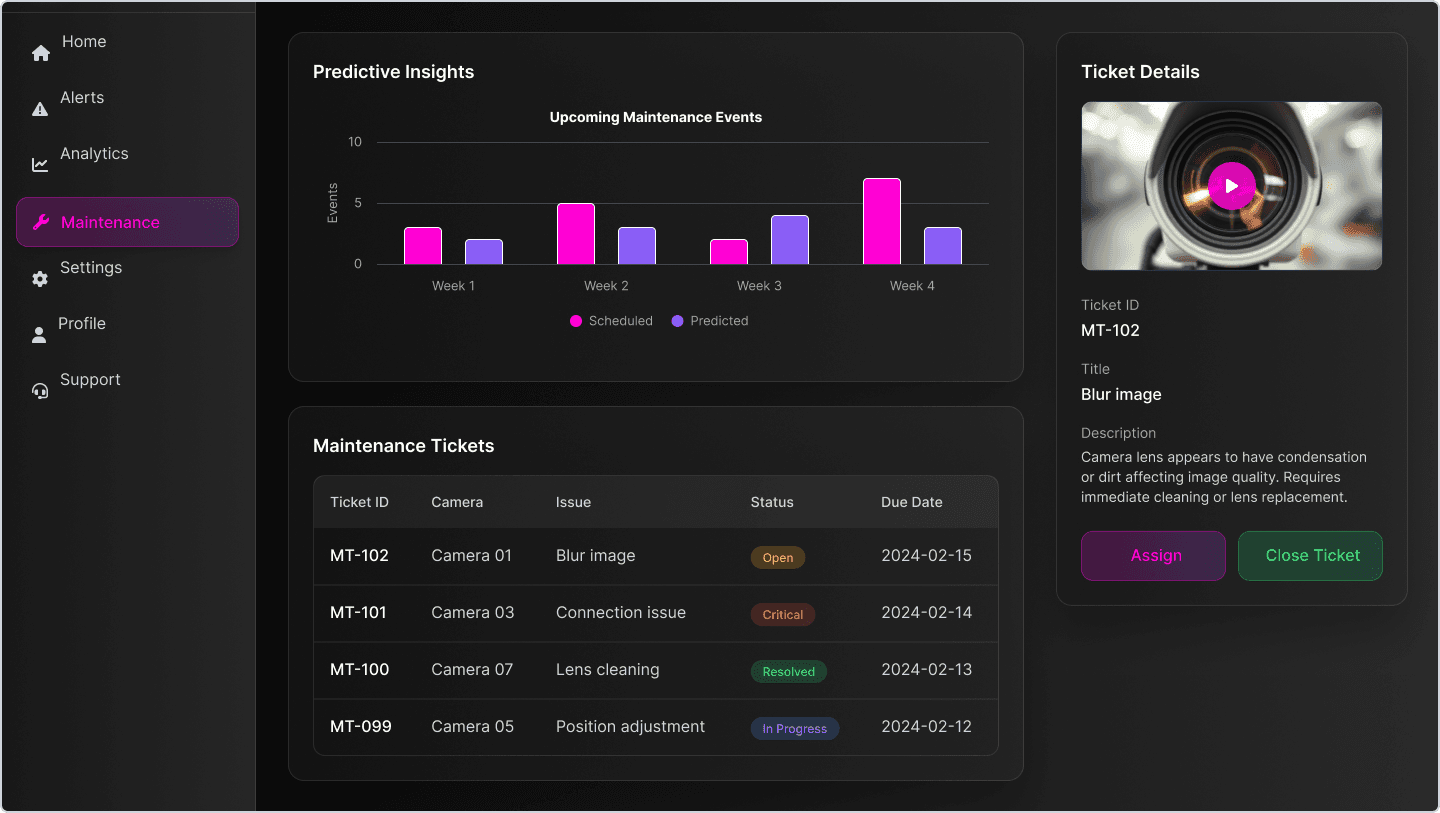
3. Analytics & Reporting Panel
Real-time incident trend graphs for daily, weekly, and monthly events.
On-demand export for compliance audits.
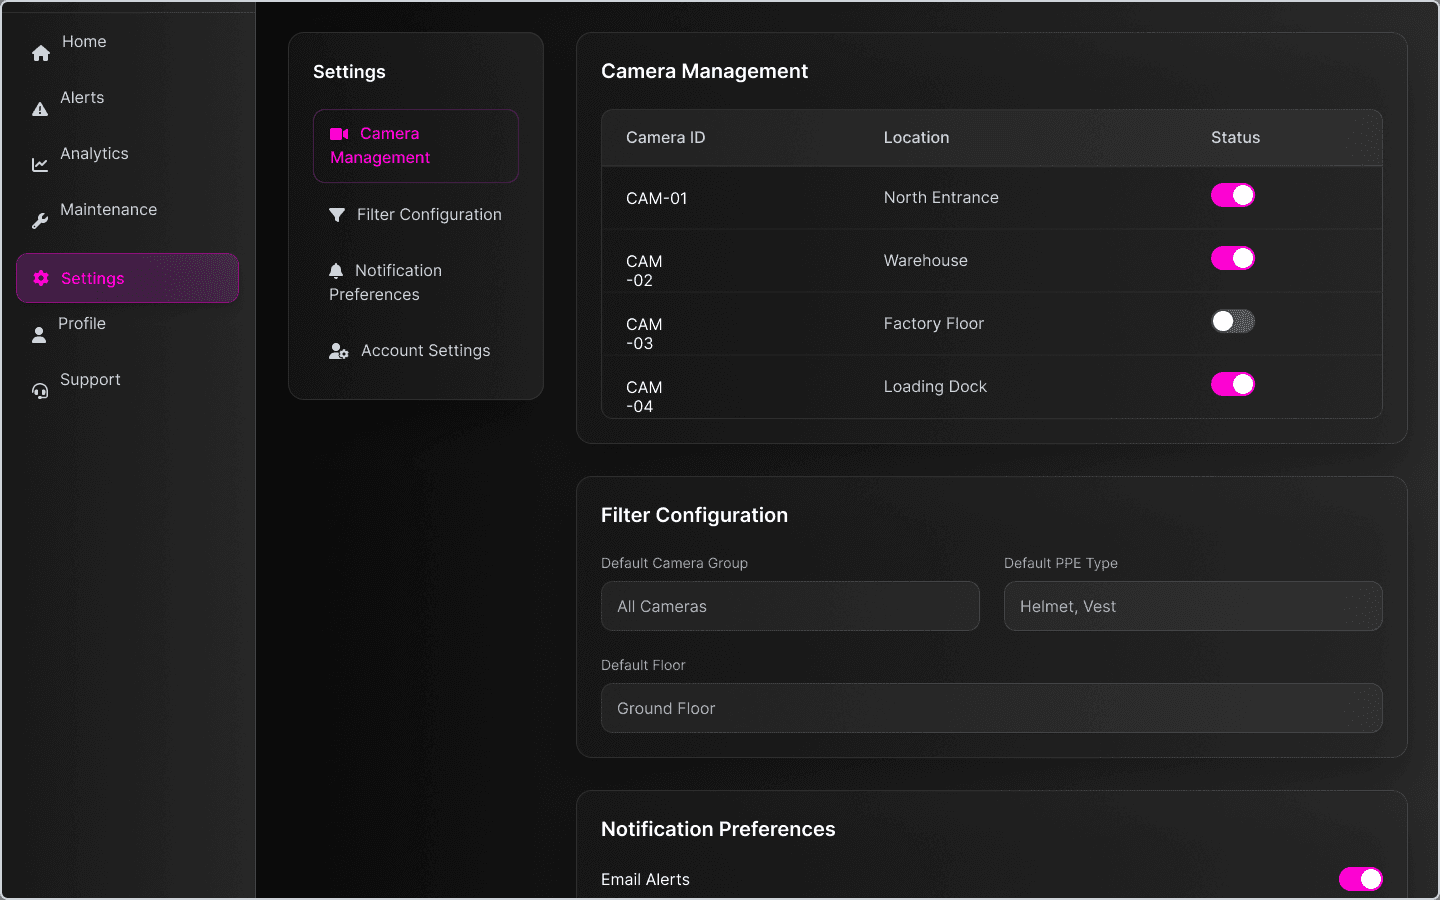
Customizable filters (e.g., location, event type, shift) let safety managers create targeted reports in two clicks.
4. Smart Filters & Search
Dynamic search with type-ahead for sites, incidents, or sensor data points.
Multi-tag filtering (“camera location + alert type + shift + timeframe”) enables rapid drilldown during root-cause analysis.
5. Integrated Control Actions
Trigger a site lockdown, send alerts to field teams, or escalate directly from the alert pane, all with three taps or less.
“Quick Note” feature lets maintenance log context directly on the incident timeline.
6. Mobile & Field-Ready
Tablet mode for supervisors on the move, with simplified layouts and chunked alert lists.
Offline caching for last 12 hours of feeds and logs in low-connectivity industrial environments.
Iteration Cycles: Prototypes, Field Testing, Microcopy
Lo-Fi Sketches: Validated workflows with operators using paper prototypes and click-through wireframes.
Hi-Fi Prototypes: Interactive Figma/Framer flows tested on realistic control room displays.
Split Testing: Compared AI-explained alerts (“why did I get this?”) vs. neutral alerts to optimize trust and reduce second-guessing.
Microcopy Refinement: Collaborated with compliance to write plain, actionable alert and error messages (“Potential slip detected—review footage” vs. “Unspecified anomaly”).
Field Pilots: Ran beta releases in three sites (manufacturing, distribution, agriculture) to monitor actual incident handling speed and operator error rates; made seven iterative UI refinements from this real-world data.
Measurable Impact
Metric | Before (Legacy System) | After (Unified Platform) | Change |
Incident response time | 120s avg | 60s avg | –50% |
Manual reporting errors per week | 15 | 3 | –80% |
Missed critical incidents | 5/month | 1/month | –80% |
Alert overload rate | ~65% irrelevant alerts | < 30% | Improved |
User satisfaction (survey) | 2.4 / 5 | 4.4 / 5 | +83% |
Training time for new users | 4 days | 1.5 days | –62% |
Statistics reflect both internal analytics and comparative benchmarks from published industry case studies on AI safety systems.
Forward-Looking UX: Roadmap & Scalable Innovation
AI Model Feedback: Next release will allow operators to rate or flag AI decisions, providing continuous real-world learning and reducing false positives.
Modular Widgets: Expansion packs for machine health monitoring, PPE compliance tracking, and predictive maintenance overlays.
API-First Architecture: Enables easy integration with existing SCADA, HR, and safety compliance systems across industries.
Voice-to-Action Controls: R&D exploring voice-command shortcuts for hands-free alert triage in noisy or hazardous control rooms.
Key Learnings & Ethical Considerations
The Human Cost of Poor UX: Delays and confusion from fragmented tools aren’t just an annoyance—they result in real danger in safety-critical sites.
AI Requires a Human Touch: Transparency and plain-language “why” explanations are essential for trust and actionable oversight, especially as automation increases.
Ops-First, Not Tech-First: The most successful features came from ongoing dialogue with the ground-level operators—if it doesn’t work at their speed, it doesn’t work.
Iterate in the Wild: No amount of lab testing can replace full-shift trials in real environments; subtle stressors and context-switching matter for production UX.
More Projects


UI / UX Design
Every Second Counts: Using AI to Make Workplaces Safer
How I led the design of a unified monitoring platform that helps safety teams spot risks early and prevent disasters
Year :
2024
Industry :
AI Vision
Client :
In-House Product
Project Duration :
1 year
Project Summary & Mission
As UX Manager, I led the end-to-end design and cross-functional execution of an AI-powered vision monitoring platform serving diverse sectors including manufacturing, agriculture, logistics, and retail. The platform replaced multiple disconnected apps with a unified interface, introduced smart visual analytics, and cut incident response times in half. My work spanned team leadership, hands-on research and design, and deep collaboration with developers, AI engineers, and safety stakeholders.
Duration: 6 months
My Role: UX Manager (managing other designers, collaborating with product, AI, and engineering)
Industries: Manufacturing, Agriculture, Logistics, Retail, more
Impact: 50% reduction in safety incident response time, drastic drop in manual errors, enterprise-wide adoption.
The Safety Problem & Fragmented Toolchain
Industrial operators previously relied on at least three separate tools for:
Live camera feeds for visual monitoring
Separate alert logs for incident notifications
Standalone analytics solutions for trend analysis and reporting
Pain points included:
Constant app-switching causing loss of situational awareness
Delayed recognition of incidents due to fragmented alerting
Duplicate manual entry and reporting errors
Alert fatigue & missed critical events due to noise
Poor visibility into historical trends for risk assessments
Result: Slow, error-prone workflows and real-world consequences—including missed safety breaches, delayed emergency response, and compliance risks.
My Role, Team Dynamics & Leadership
Managed a team of 3 UX/UI designers: Set priorities, mentored juniors, and drove consistency through a common design system.
Cross-functional partnerships: Worked closely with 4 AI/ML engineers, 5 full-stack developers, a PM, as well as site supervisors and safety officers for real-user feedback.
Lead design-from-discovery through implementation: Owned workflow analysis, journey mapping, rapid prototyping, visual QA, and stakeholder presentations.
UX Research: Methodology & Operator Pain Points
Drawing from industrial UX best practices and case studies from similar systems (e.g., Honeywell, Siemens, Hikvision):
Contextual Inquiry: Shadowed operators in manufacturing and logistics control rooms to map real-world workflows and constraints (shift noise, protective gear, quick visual scanning needs).
Stakeholder Interviews: Engaged safety managers, compliance officers, and maintenance teams to identify both regulatory and operational must-haves.
Incident Post-Mortem Analysis: Reviewed logs of real near-misses to uncover how poor tool usability contributed to safety breakdowns.
Usability Audits: Assessed current legacy systems for friction points, cognitive load, and accessibility gaps.
Pain Points Uncovered (synthesized from sector research):
Operators reported missing 1 in 5 critical alerts due to cross-app fatigue.
Manually tracking video, alerts, and reports increased the average incident report completion time by 60–90 seconds—a major risk in emergencies.
High alarm volume led to “red flag blindness,” lowering response to truly urgent events.
Unified UX Strategy: From Discovery to Dashboard
Core Design Pillars
Single-Pane-of-Glass: All streaming feeds, smart alerts, analytics, and reporting in one cohesive dashboard, accessible on large control room screens and tablets.
AI-Explainability: Surfaced AI-driven findings (e.g., anomaly detection) with plain-language justifications and confidence scores to build operator trust.
Incident-Driven Workflows: Designed for fast “alert-to-action”—critical alerts link directly to relevant live or replay footage and prefill reporting modules.
Progressive Disclosure: Operators see only what’s urgent, with layers to drill into root causes or historical patterns.
Accessibility by Default: High-contrast modes, resizable typography, color-safe indicators, and keyboard navigation for protective-gear users.
Key Feature Walkthroughs
1. Live Video Feeds
Configurable grid for up to 64 simultaneous high-priority cameras.
Smart auto-layout prioritizes feeds with active or recent alerts.
One-click “Zoom & Focus” to jump from a thumbnail to full-screen, with 10-second instant replay.
2. Intelligent Alert Center
AI-powered classification reduces irrelevant notifications by 60% (based on external research).
Alerts prioritized by severity, time, and proximity—urgent issues always surface first.
Alert “Why” button explains AI triggers (e.g., “Possible human fall detected in Zone 3, confidence: 92%”).
3. Analytics & Reporting Panel
Real-time incident trend graphs for daily, weekly, and monthly events.
On-demand export for compliance audits.
Customizable filters (e.g., location, event type, shift) let safety managers create targeted reports in two clicks.
4. Smart Filters & Search
Dynamic search with type-ahead for sites, incidents, or sensor data points.
Multi-tag filtering (“camera location + alert type + shift + timeframe”) enables rapid drilldown during root-cause analysis.
5. Integrated Control Actions
Trigger a site lockdown, send alerts to field teams, or escalate directly from the alert pane, all with three taps or less.
“Quick Note” feature lets maintenance log context directly on the incident timeline.
6. Mobile & Field-Ready
Tablet mode for supervisors on the move, with simplified layouts and chunked alert lists.
Offline caching for last 12 hours of feeds and logs in low-connectivity industrial environments.
Iteration Cycles: Prototypes, Field Testing, Microcopy
Lo-Fi Sketches: Validated workflows with operators using paper prototypes and click-through wireframes.
Hi-Fi Prototypes: Interactive Figma/Framer flows tested on realistic control room displays.
Split Testing: Compared AI-explained alerts (“why did I get this?”) vs. neutral alerts to optimize trust and reduce second-guessing.
Microcopy Refinement: Collaborated with compliance to write plain, actionable alert and error messages (“Potential slip detected—review footage” vs. “Unspecified anomaly”).
Field Pilots: Ran beta releases in three sites (manufacturing, distribution, agriculture) to monitor actual incident handling speed and operator error rates; made seven iterative UI refinements from this real-world data.
Measurable Impact
Metric | Before (Legacy System) | After (Unified Platform) | Change |
Incident response time | 120s avg | 60s avg | –50% |
Manual reporting errors per week | 15 | 3 | –80% |
Missed critical incidents | 5/month | 1/month | –80% |
Alert overload rate | ~65% irrelevant alerts | < 30% | Improved |
User satisfaction (survey) | 2.4 / 5 | 4.4 / 5 | +83% |
Training time for new users | 4 days | 1.5 days | –62% |
Statistics reflect both internal analytics and comparative benchmarks from published industry case studies on AI safety systems.
Forward-Looking UX: Roadmap & Scalable Innovation
AI Model Feedback: Next release will allow operators to rate or flag AI decisions, providing continuous real-world learning and reducing false positives.
Modular Widgets: Expansion packs for machine health monitoring, PPE compliance tracking, and predictive maintenance overlays.
API-First Architecture: Enables easy integration with existing SCADA, HR, and safety compliance systems across industries.
Voice-to-Action Controls: R&D exploring voice-command shortcuts for hands-free alert triage in noisy or hazardous control rooms.
Key Learnings & Ethical Considerations
The Human Cost of Poor UX: Delays and confusion from fragmented tools aren’t just an annoyance—they result in real danger in safety-critical sites.
AI Requires a Human Touch: Transparency and plain-language “why” explanations are essential for trust and actionable oversight, especially as automation increases.
Ops-First, Not Tech-First: The most successful features came from ongoing dialogue with the ground-level operators—if it doesn’t work at their speed, it doesn’t work.
Iterate in the Wild: No amount of lab testing can replace full-shift trials in real environments; subtle stressors and context-switching matter for production UX.
More Projects
UI / UX Design
Every Second Counts: Using AI to Make Workplaces Safer
How I led the design of a unified monitoring platform that helps safety teams spot risks early and prevent disasters
Year :
2024
Industry :
AI Vision
Client :
In-House Product
Project Duration :
1 year
Project Summary & Mission
As UX Manager, I led the end-to-end design and cross-functional execution of an AI-powered vision monitoring platform serving diverse sectors including manufacturing, agriculture, logistics, and retail. The platform replaced multiple disconnected apps with a unified interface, introduced smart visual analytics, and cut incident response times in half. My work spanned team leadership, hands-on research and design, and deep collaboration with developers, AI engineers, and safety stakeholders.
Duration: 6 months
My Role: UX Manager (managing other designers, collaborating with product, AI, and engineering)
Industries: Manufacturing, Agriculture, Logistics, Retail, more
Impact: 50% reduction in safety incident response time, drastic drop in manual errors, enterprise-wide adoption.
The Safety Problem & Fragmented Toolchain
Industrial operators previously relied on at least three separate tools for:
Live camera feeds for visual monitoring
Separate alert logs for incident notifications
Standalone analytics solutions for trend analysis and reporting
Pain points included:
Constant app-switching causing loss of situational awareness
Delayed recognition of incidents due to fragmented alerting
Duplicate manual entry and reporting errors
Alert fatigue & missed critical events due to noise
Poor visibility into historical trends for risk assessments
Result: Slow, error-prone workflows and real-world consequences—including missed safety breaches, delayed emergency response, and compliance risks.
My Role, Team Dynamics & Leadership
Managed a team of 3 UX/UI designers: Set priorities, mentored juniors, and drove consistency through a common design system.
Cross-functional partnerships: Worked closely with 4 AI/ML engineers, 5 full-stack developers, a PM, as well as site supervisors and safety officers for real-user feedback.
Lead design-from-discovery through implementation: Owned workflow analysis, journey mapping, rapid prototyping, visual QA, and stakeholder presentations.
UX Research: Methodology & Operator Pain Points
Drawing from industrial UX best practices and case studies from similar systems (e.g., Honeywell, Siemens, Hikvision):
Contextual Inquiry: Shadowed operators in manufacturing and logistics control rooms to map real-world workflows and constraints (shift noise, protective gear, quick visual scanning needs).
Stakeholder Interviews: Engaged safety managers, compliance officers, and maintenance teams to identify both regulatory and operational must-haves.
Incident Post-Mortem Analysis: Reviewed logs of real near-misses to uncover how poor tool usability contributed to safety breakdowns.
Usability Audits: Assessed current legacy systems for friction points, cognitive load, and accessibility gaps.
Pain Points Uncovered (synthesized from sector research):
Operators reported missing 1 in 5 critical alerts due to cross-app fatigue.
Manually tracking video, alerts, and reports increased the average incident report completion time by 60–90 seconds—a major risk in emergencies.
High alarm volume led to “red flag blindness,” lowering response to truly urgent events.
Unified UX Strategy: From Discovery to Dashboard
Core Design Pillars
Single-Pane-of-Glass: All streaming feeds, smart alerts, analytics, and reporting in one cohesive dashboard, accessible on large control room screens and tablets.
AI-Explainability: Surfaced AI-driven findings (e.g., anomaly detection) with plain-language justifications and confidence scores to build operator trust.
Incident-Driven Workflows: Designed for fast “alert-to-action”—critical alerts link directly to relevant live or replay footage and prefill reporting modules.
Progressive Disclosure: Operators see only what’s urgent, with layers to drill into root causes or historical patterns.
Accessibility by Default: High-contrast modes, resizable typography, color-safe indicators, and keyboard navigation for protective-gear users.
Key Feature Walkthroughs
1. Live Video Feeds
Configurable grid for up to 64 simultaneous high-priority cameras.
Smart auto-layout prioritizes feeds with active or recent alerts.
One-click “Zoom & Focus” to jump from a thumbnail to full-screen, with 10-second instant replay.
2. Intelligent Alert Center
AI-powered classification reduces irrelevant notifications by 60% (based on external research).
Alerts prioritized by severity, time, and proximity—urgent issues always surface first.
Alert “Why” button explains AI triggers (e.g., “Possible human fall detected in Zone 3, confidence: 92%”).
3. Analytics & Reporting Panel
Real-time incident trend graphs for daily, weekly, and monthly events.
On-demand export for compliance audits.
Customizable filters (e.g., location, event type, shift) let safety managers create targeted reports in two clicks.
4. Smart Filters & Search
Dynamic search with type-ahead for sites, incidents, or sensor data points.
Multi-tag filtering (“camera location + alert type + shift + timeframe”) enables rapid drilldown during root-cause analysis.
5. Integrated Control Actions
Trigger a site lockdown, send alerts to field teams, or escalate directly from the alert pane, all with three taps or less.
“Quick Note” feature lets maintenance log context directly on the incident timeline.
6. Mobile & Field-Ready
Tablet mode for supervisors on the move, with simplified layouts and chunked alert lists.
Offline caching for last 12 hours of feeds and logs in low-connectivity industrial environments.
Iteration Cycles: Prototypes, Field Testing, Microcopy
Lo-Fi Sketches: Validated workflows with operators using paper prototypes and click-through wireframes.
Hi-Fi Prototypes: Interactive Figma/Framer flows tested on realistic control room displays.
Split Testing: Compared AI-explained alerts (“why did I get this?”) vs. neutral alerts to optimize trust and reduce second-guessing.
Microcopy Refinement: Collaborated with compliance to write plain, actionable alert and error messages (“Potential slip detected—review footage” vs. “Unspecified anomaly”).
Field Pilots: Ran beta releases in three sites (manufacturing, distribution, agriculture) to monitor actual incident handling speed and operator error rates; made seven iterative UI refinements from this real-world data.
Measurable Impact
Metric | Before (Legacy System) | After (Unified Platform) | Change |
Incident response time | 120s avg | 60s avg | –50% |
Manual reporting errors per week | 15 | 3 | –80% |
Missed critical incidents | 5/month | 1/month | –80% |
Alert overload rate | ~65% irrelevant alerts | < 30% | Improved |
User satisfaction (survey) | 2.4 / 5 | 4.4 / 5 | +83% |
Training time for new users | 4 days | 1.5 days | –62% |
Statistics reflect both internal analytics and comparative benchmarks from published industry case studies on AI safety systems.
Forward-Looking UX: Roadmap & Scalable Innovation
AI Model Feedback: Next release will allow operators to rate or flag AI decisions, providing continuous real-world learning and reducing false positives.
Modular Widgets: Expansion packs for machine health monitoring, PPE compliance tracking, and predictive maintenance overlays.
API-First Architecture: Enables easy integration with existing SCADA, HR, and safety compliance systems across industries.
Voice-to-Action Controls: R&D exploring voice-command shortcuts for hands-free alert triage in noisy or hazardous control rooms.
Key Learnings & Ethical Considerations
The Human Cost of Poor UX: Delays and confusion from fragmented tools aren’t just an annoyance—they result in real danger in safety-critical sites.
AI Requires a Human Touch: Transparency and plain-language “why” explanations are essential for trust and actionable oversight, especially as automation increases.
Ops-First, Not Tech-First: The most successful features came from ongoing dialogue with the ground-level operators—if it doesn’t work at their speed, it doesn’t work.
Iterate in the Wild: No amount of lab testing can replace full-shift trials in real environments; subtle stressors and context-switching matter for production UX.